Setting Up Data Monitoring Dashboard
Utilize TaskLabs Data Monitoring Dashboard to keep track of your automation activities and resource usage efficiently. Follow the steps below to set up and understand your data monitoring dashboard.
Navigate to the Dashboard
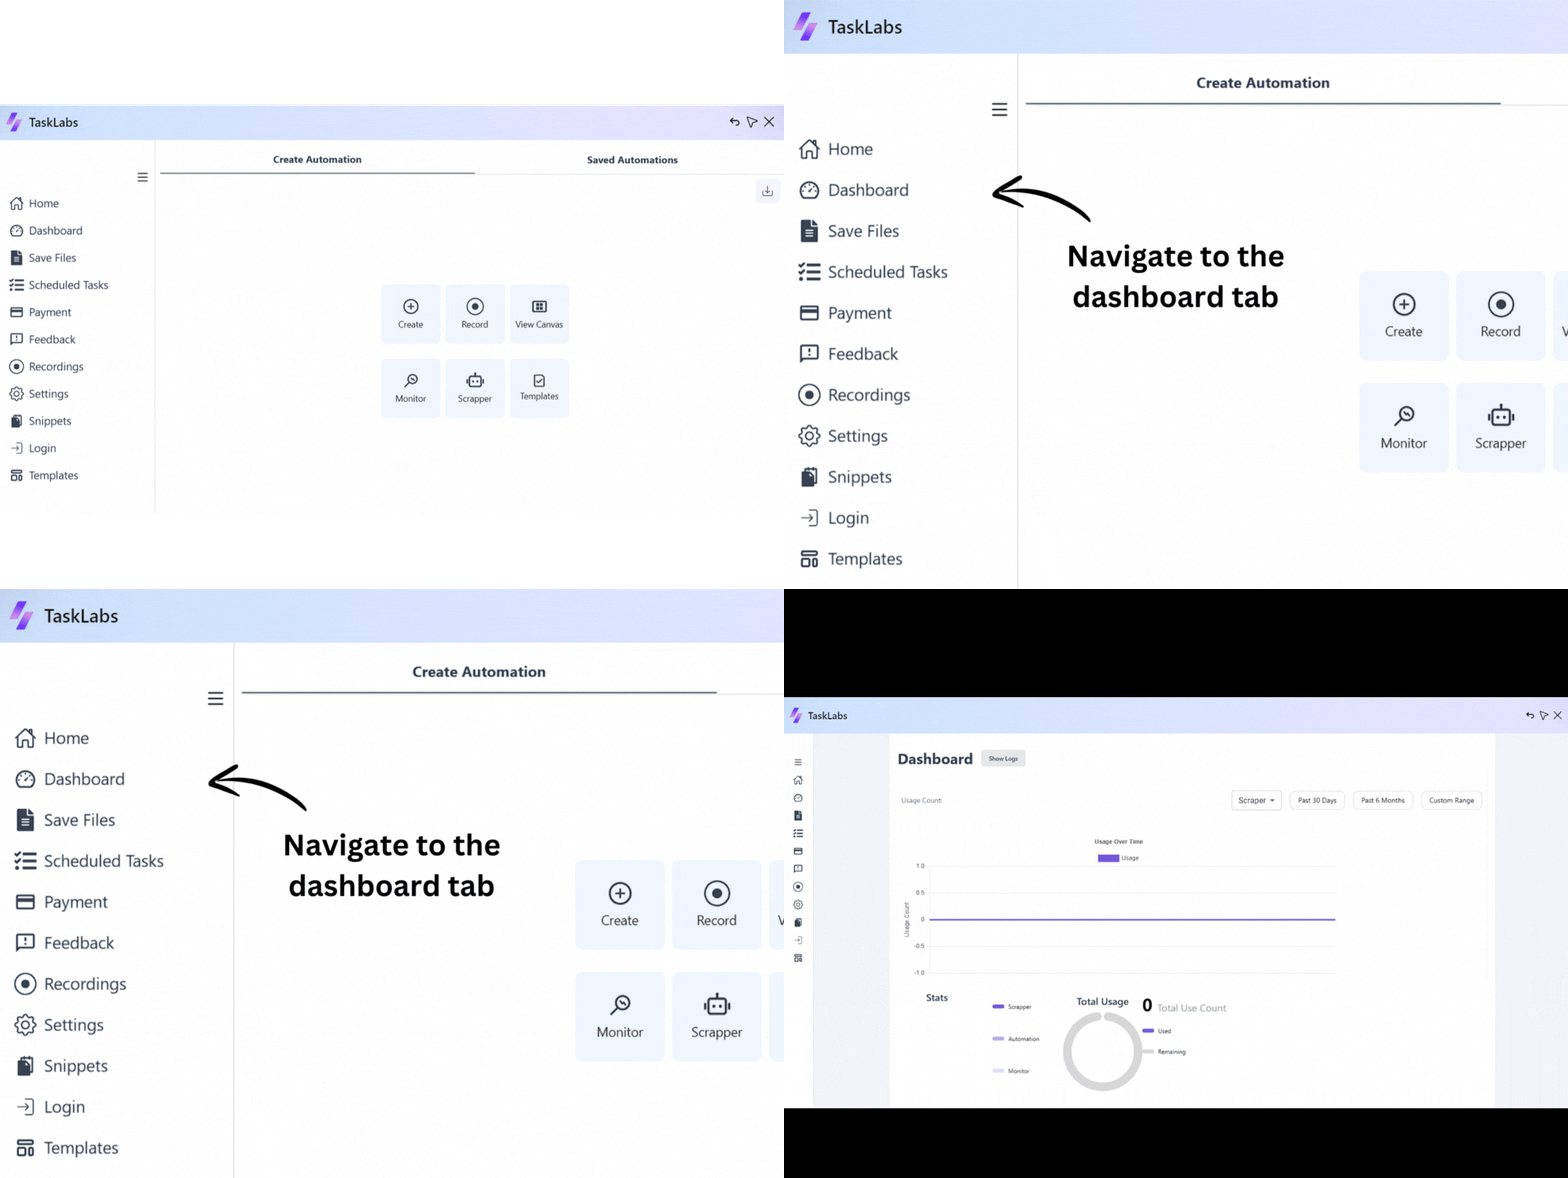
Begin by navigating to the "Dashboard" option in the sidebar menu. Clicking this will open the dashboard page, where you can view various metrics and statistics related to your automation usage.

Understand Usage Metrics
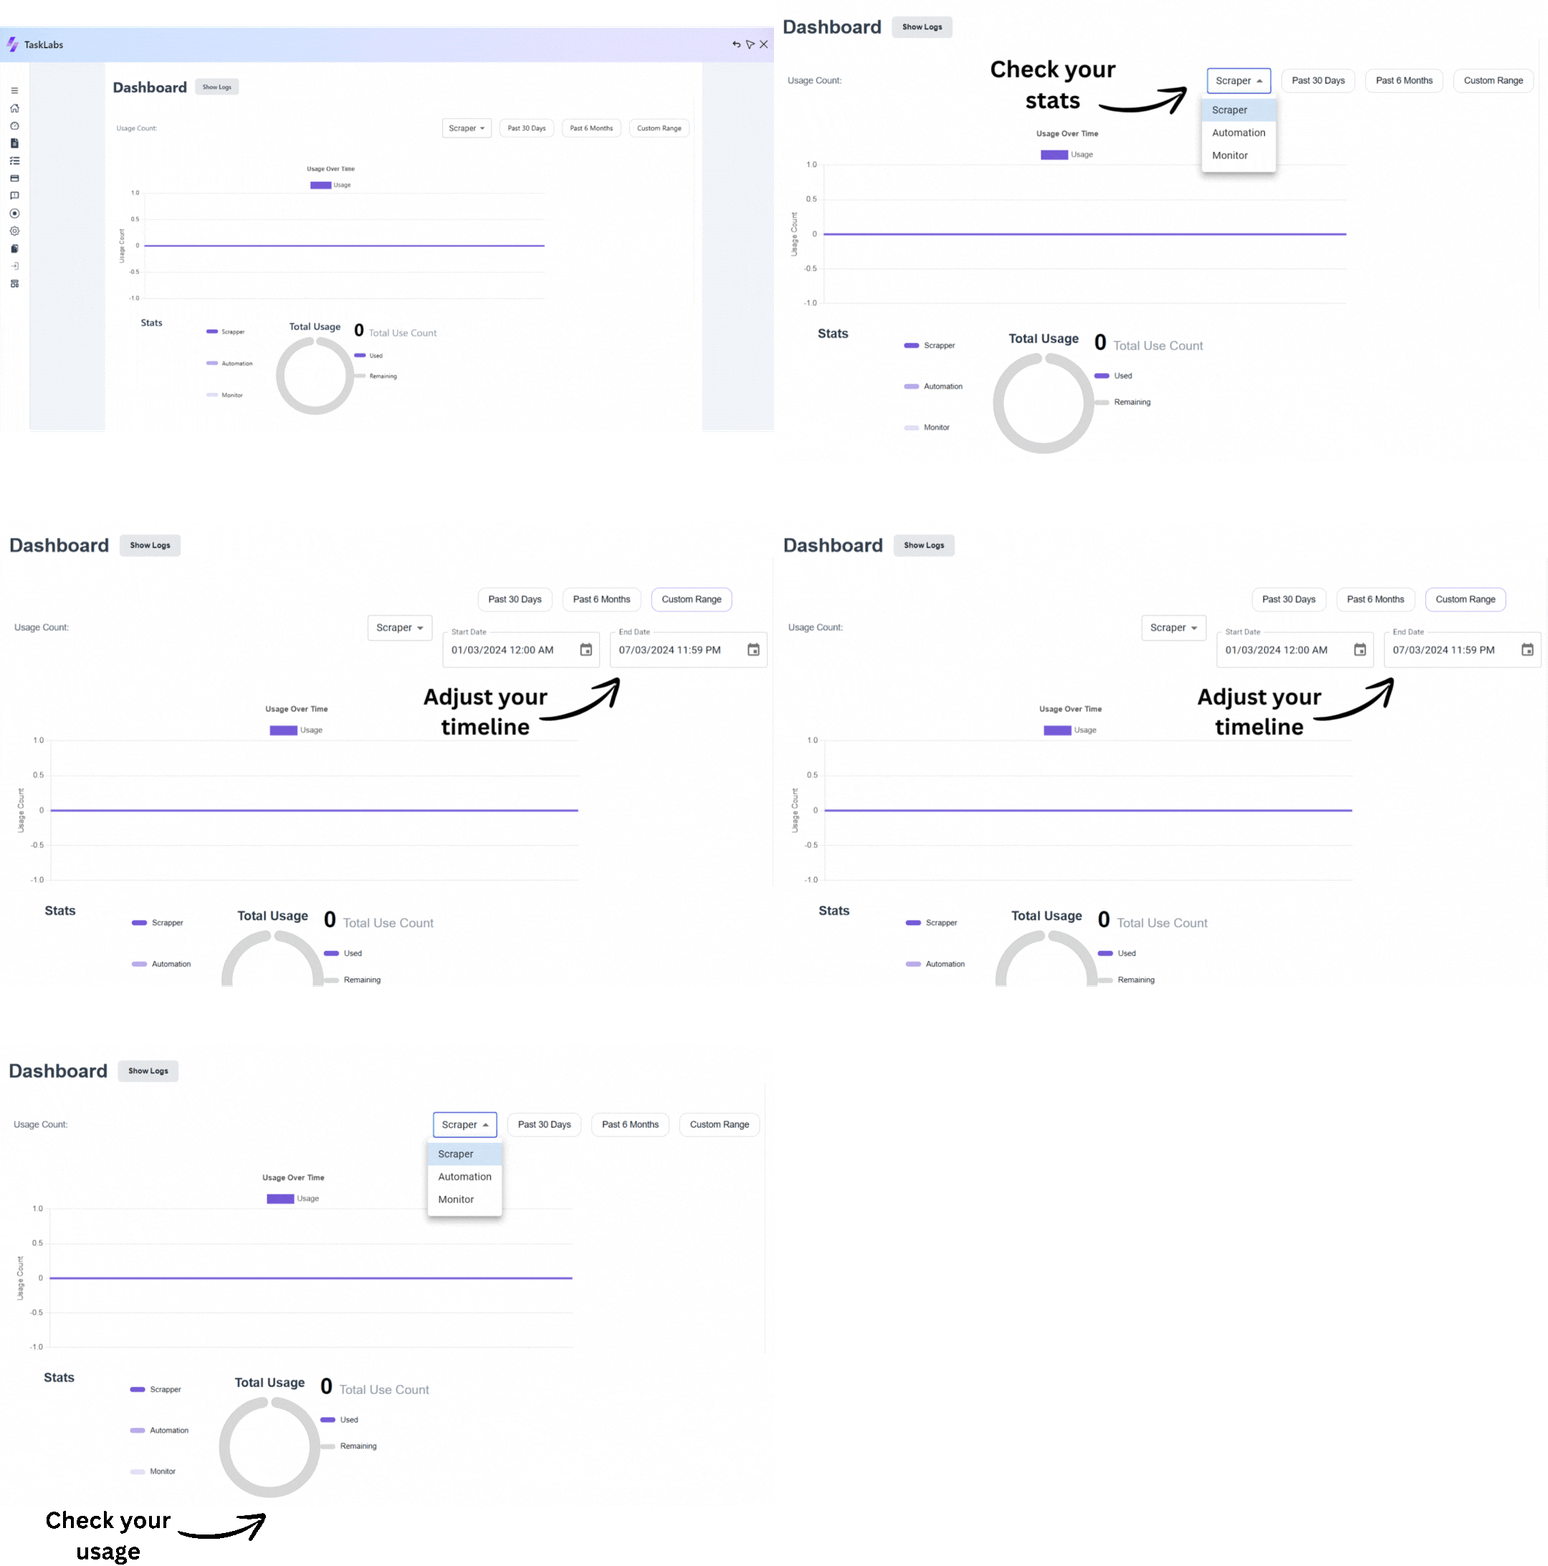
The dashboard shows usage count, usage over time, and total usage. You can view stats for Scraper, Automation, and Monitor, and adjust the time range for the data displayed.

Analyze Logs and Trends
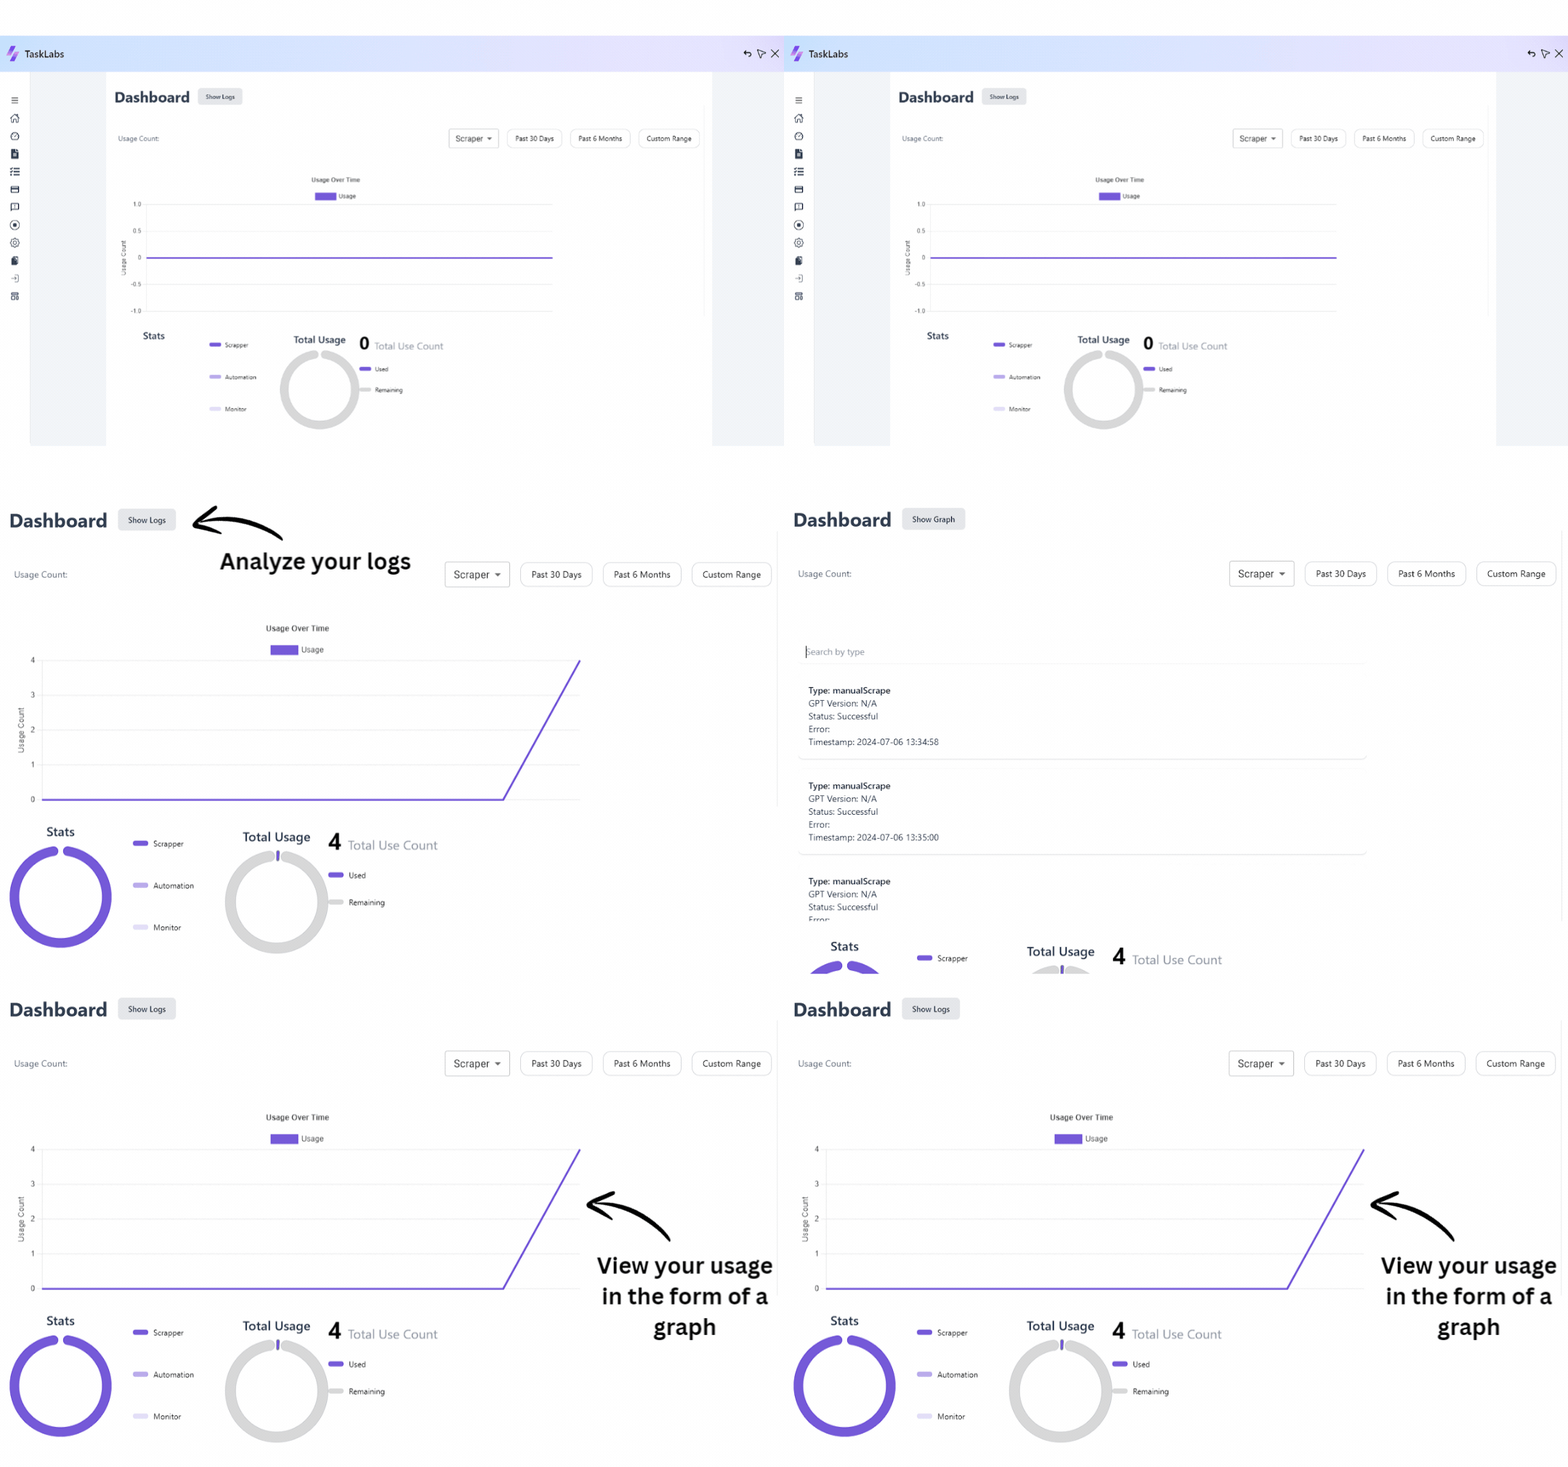
Click on the "Show Logs" button to see detailed logs of your automation activities, helping you analyze trends and optimize your automations.
